0It worked on my machine
I am building an autonomous AI coding agent. It clones a repository, checks out a branch, invokes an LLM, writes some tests, runs them, and opens a pull request. It worked beautifully on my machine.
Then I exposed a raw Express webhook, threw a couple of parallel test requests at it, and the server locked up. The Linux Out-of-Memory killer terminated my Node process. My host filesystem got corrupted by concurrent git lock files. My gateway threw 504 timeouts. I had to SSH in and restart everything manually.1
index.lock files in the same worktree. Two jobs sharing one checkout directory is not a race you can tune away; it is a guarantee of corruption.That experience is what made me actually think about production agent deployments. Deploying a heavy autonomous coding agent is nothing like deploying a standard API microservice. You are not scaling HTTP requests. You are scaling untrusted operating system workloads, and that requires a completely different mental model.
This is the architecture I arrived at, and what I would do differently.
1Why simple agent setups fall apart
When you run agent shell commands directly on your bare-metal host, the runner has full access to your environment. If the LLM writes an unsafe script or the cloned repository contains malicious install hooks, it can read your secrets, delete files, or quietly install a backdoor. This is not a theoretical concern. It happens.
Beyond security, three operational problems show up fast when you increase concurrency:
Resource exhaustion
A single agent running npm install, compiling TypeScript, and executing a full test suite consumes around two cores and 1.5 GB of RAM. Run ten of those in parallel and a standard VM hits CPU starvation within minutes. The system becomes unresponsive and jobs start timing out or failing silently.
Network gateway timeouts
AI agents are slow by nature. They plan, reason, write code, verify it, and sometimes loop back to fix mistakes. A single run takes ten to twenty minutes. If your HTTP connection stays open waiting for a response, your reverse proxy (Nginx, Caddy, Cloudflare) terminates the connection long before the agent finishes. The user sees a failed request even though the work is still running in the background.
Filesystem collisions
If two concurrent jobs clone or run commands in the same workspace path, git and package managers throw lock exceptions. Both jobs crash and neither produces output.
LessonNone of these are edge cases. They are the default outcomes of running untrusted, long-running, resource-hungry workloads behind a synchronous request-response cycle.
2The architecture that actually works
To handle 100 or more concurrent agent jobs without the system falling apart, separate three concerns: ingestion, scheduling, and execution. None of them should live in the same synchronous request-response cycle.
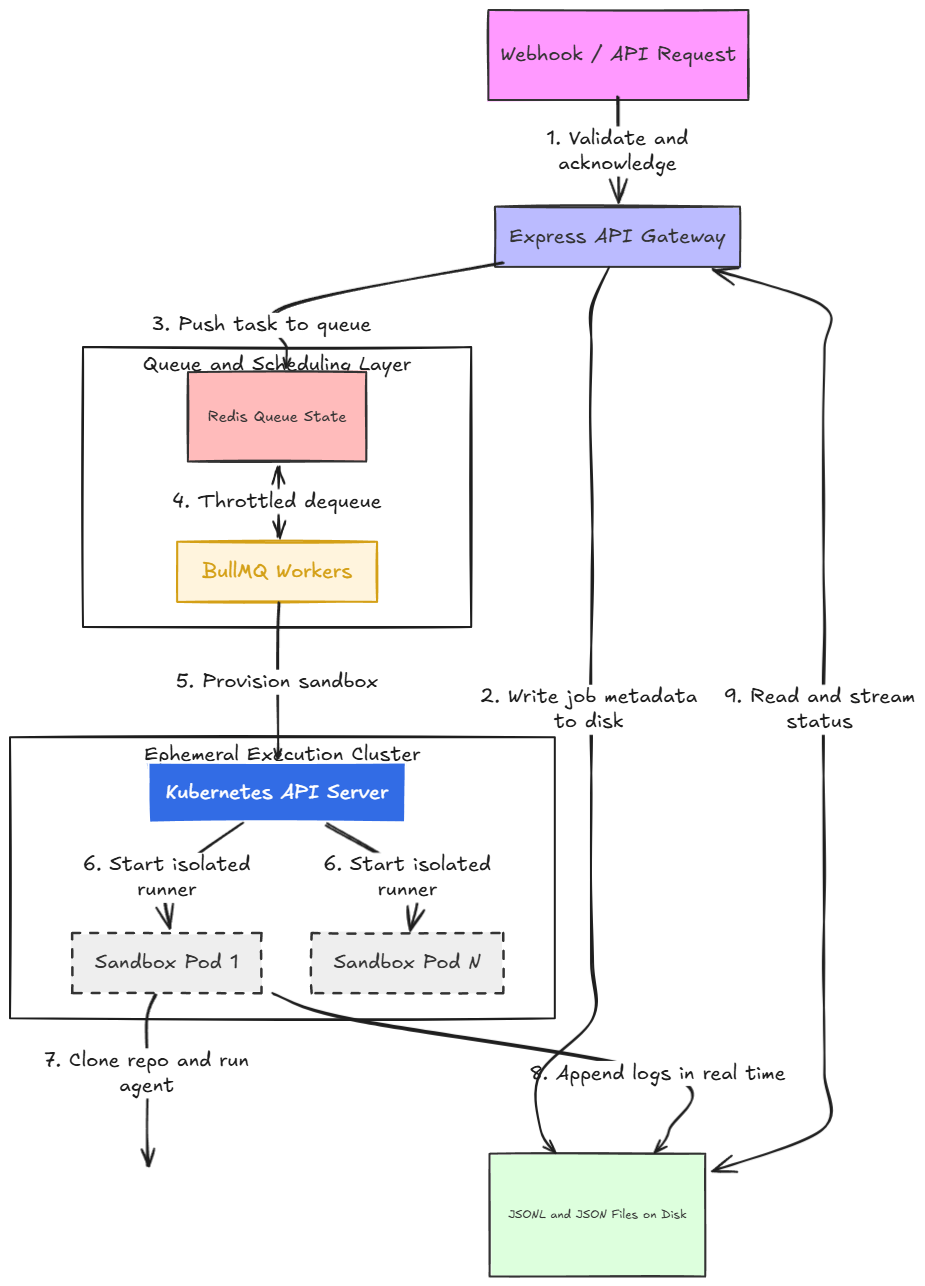
The ingestion layer receives the webhook and returns a job ID within milliseconds. The scheduling layer manages concurrency so the cluster never gets overloaded. The execution layer runs each job in a completely isolated container that is destroyed when the work is done. Disk-based logging makes the system observable without burning memory. The original sketch I drew of these flows lives at bin/assests/image.png.
3The three things to get right
Asynchronous job queuing
The single most important change is to stop waiting for the agent to finish before responding to the HTTP request. Return a job ID immediately, write the initial status to disk, push the task into a queue, and close the connection. The client polls for status updates.2
This one change eliminates gateway timeouts entirely. It also gives you natural backpressure. When 100 requests arrive simultaneously, only a fixed number start running; the rest wait in Redis without consuming CPU or memory. You control the concurrency cap and tune it to your hardware.
BullMQ makes this straightforward. Set a concurrency limit on your workers and the library handles the rest. If a worker crashes mid-job, BullMQ retries automatically. Add a new worker process and it picks up from the queue without coordination overhead.
Ephemeral sandbox pods
Running agent code in an isolated container separates a toy from a production system. When a job starts, your worker calls the Kubernetes API to create a Pod with a minimal base image, strict limits, and no access to internal cluster services:
resources:
  limits:
    cpu: "2"
    memory: "2Gi"
  requests:
    cpu: "500m"
    memory: "512Mi"
Inside that Pod the agent can clone repositories, install packages, run tests, and push commits to GitHub. It cannot reach your database, your Redis instance, or any other running Pod. When the job finishes, the worker deletes the Pod and all ephemeral state is gone; cluster resources return immediately for the next job.
This model also makes horizontal scaling trivial. Run workers across multiple physical machines and the Kubernetes scheduler distributes Pods automatically. Adding a VM adds capacity without application-level changes.
JSONL logging for real-time observability
Users want to know what their autonomous developer is doing while it runs. Returning a single summary JSON object after twenty minutes is not acceptable.
The naive solution accumulates logs in memory and flushes at the end: memory grows without bound, data dies with the process, and polling clients get nothing until completion. The better approach writes logs to disk in JSON Lines format as they happen. Each entry is one JSON object appended to a file. The file grows incrementally and can be read from any point. When a client polls the status endpoint, the server reads the file, parses each line, and returns formatted entries alongside job metadata.
Real-time observability with near-zero memory overhead and full persistence across restarts.
4Isolation tradeoffs at different stages
Not every project needs Kubernetes from day one:
| Isolation model | Security | Memory cost | Startup | When to use |
|---|---|---|---|---|
| Bare metal host | none | negligible | instant | personal scripts only |
| Local Docker daemon | medium | low | 1 to 2 s | early stage, single VM, private repos |
| Kubernetes Pods | high | medium | 2 to 4 s | production, multi-tenant, external users |
On a single Hetzner VM with low traffic and trusted repositories, Docker is a reasonable middle ground. If untrusted users can point the agent at arbitrary repositories, Kubernetes with tight NetworkPolicies is the only responsible choice.
5How autoscaling ties it together
The power shows up when you combine BullMQ queue depth with cluster autoscaling. Configure the cluster to watch queue length and spin up additional VM nodes when the backlog exceeds a threshold. When the queue drains, the extra nodes terminate and you stop paying for them.3
Infrastructure cost tracks actual usage almost perfectly. At 3am with nobody submitting jobs, you run minimal infrastructure. During a spike the cluster expands automatically and contracts when the work is done.
Pre-pull sandbox images on each node to eliminate the download penalty: with a cached image, a new Pod goes from scheduled to running in under two seconds.
6The honest summary
None of this is complicated once you understand why each piece exists. The queue exists because HTTP connections are fragile and agents are slow. Sandbox Pods exist because agent code is untrusted and resource-hungry. JSONL logging exists because memory is finite and processes crash.
LessonBuild for composition, not for scale. Start with a single VM running K3s and local Redis for almost nothing; scale horizontally to a multi-cloud cluster later without changing application code. Only the infrastructure configuration scales up.
7References
- BullMQ documentation: worker concurrency, retries, and queue events.
- Kubernetes Pods concepts: lifecycle, resource requests and limits.
- KEDA: event-driven autoscaling from queue depth.
- JSON Lines: the one-object-per-line log format used for observability.
- Local artifacts:
bin/blogs/deploying-agents-on-scale.md(original note) andbin/assests/image.png(hand-drawn architecture sketch).